Network Monitoring System
Realtime infrastructure monitoring
Network Monitoring System
A scalable monitoring platform for network devices, combining Vert.x services, a concurrent Go plugin engine, async messaging, SQL persistence, and a React dashboard for live operational visibility.
Problem
Monitoring platforms need reliable data flow under constant load
Network monitoring requires frequent metric collection, device-specific polling logic, reliable persistence, and interfaces that make live system health easy to scan.
Device metrics
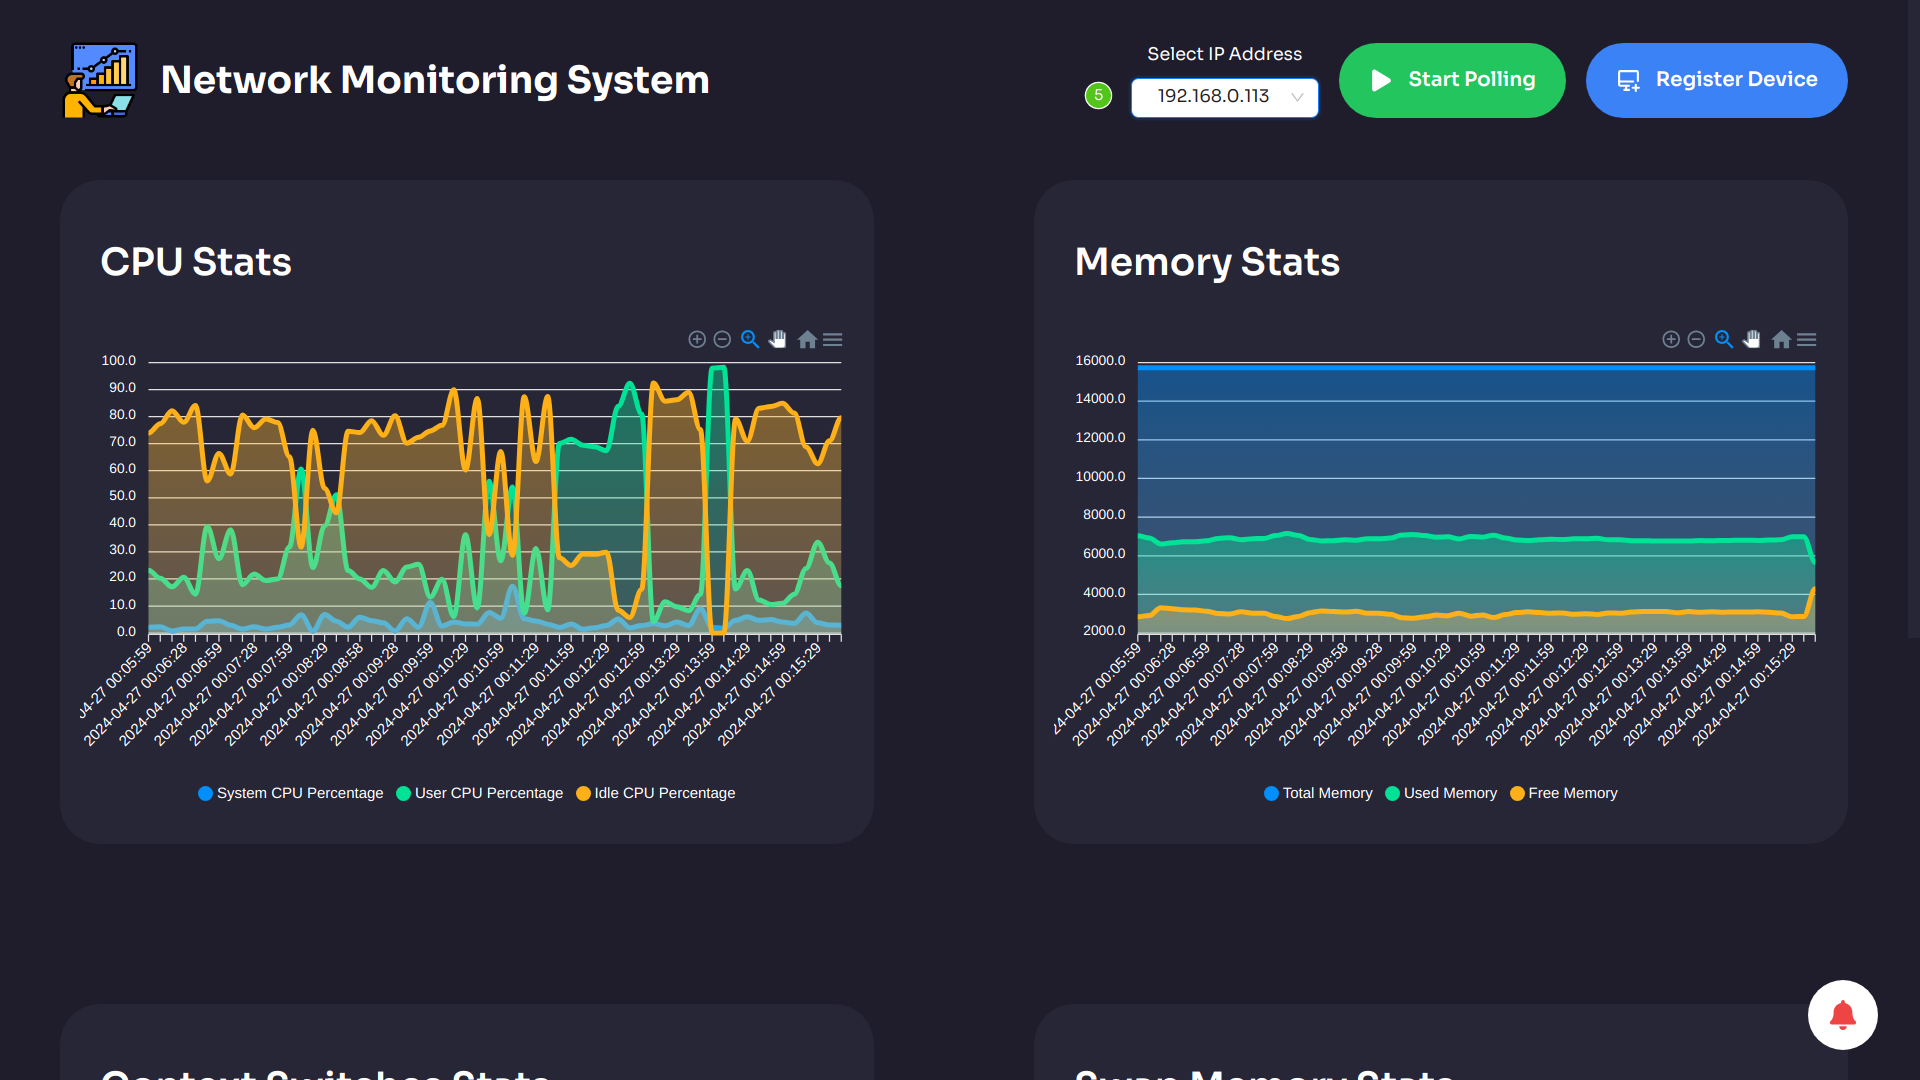
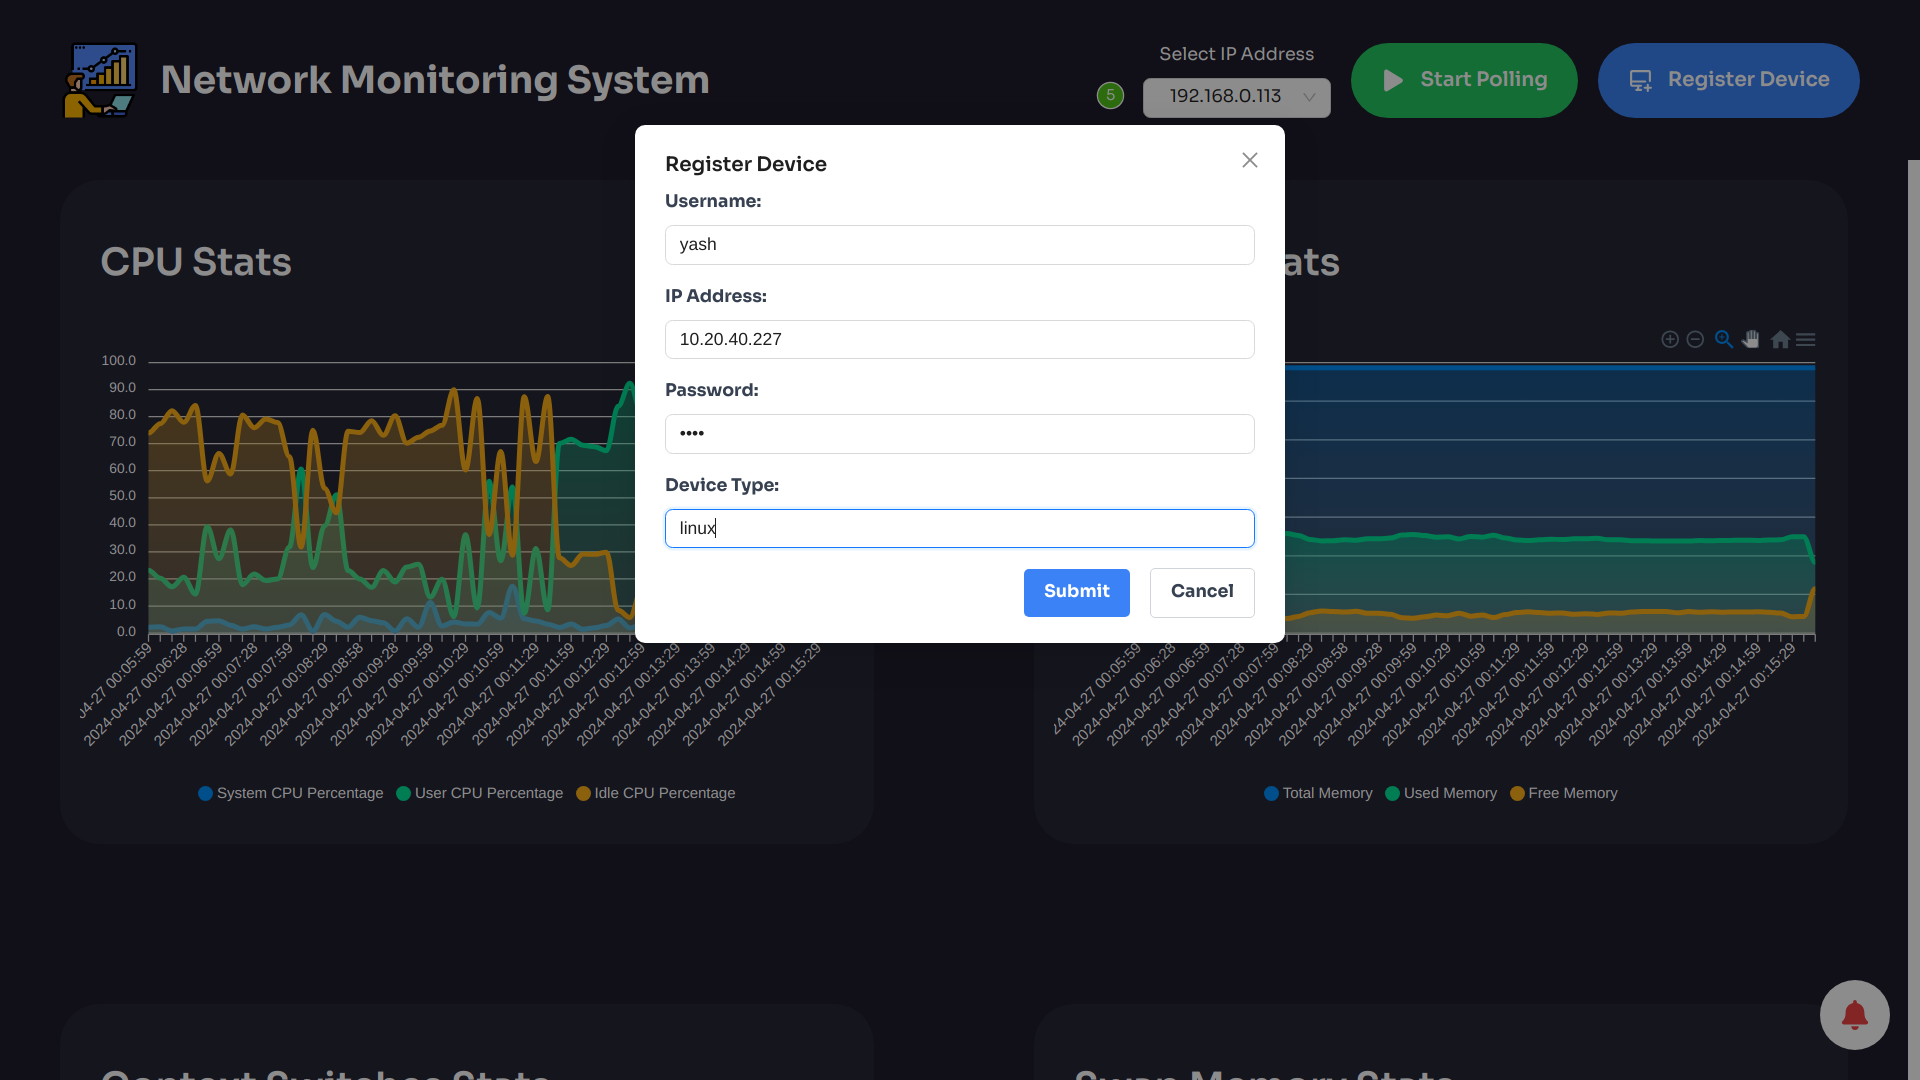
CPU, memory, and operational metrics are collected for routers, switches, firewalls, and related network devices.
Plugin engine
A Go-based plugin engine handles high-concurrency device communication and isolates device-specific collection behavior.
Operations dashboard
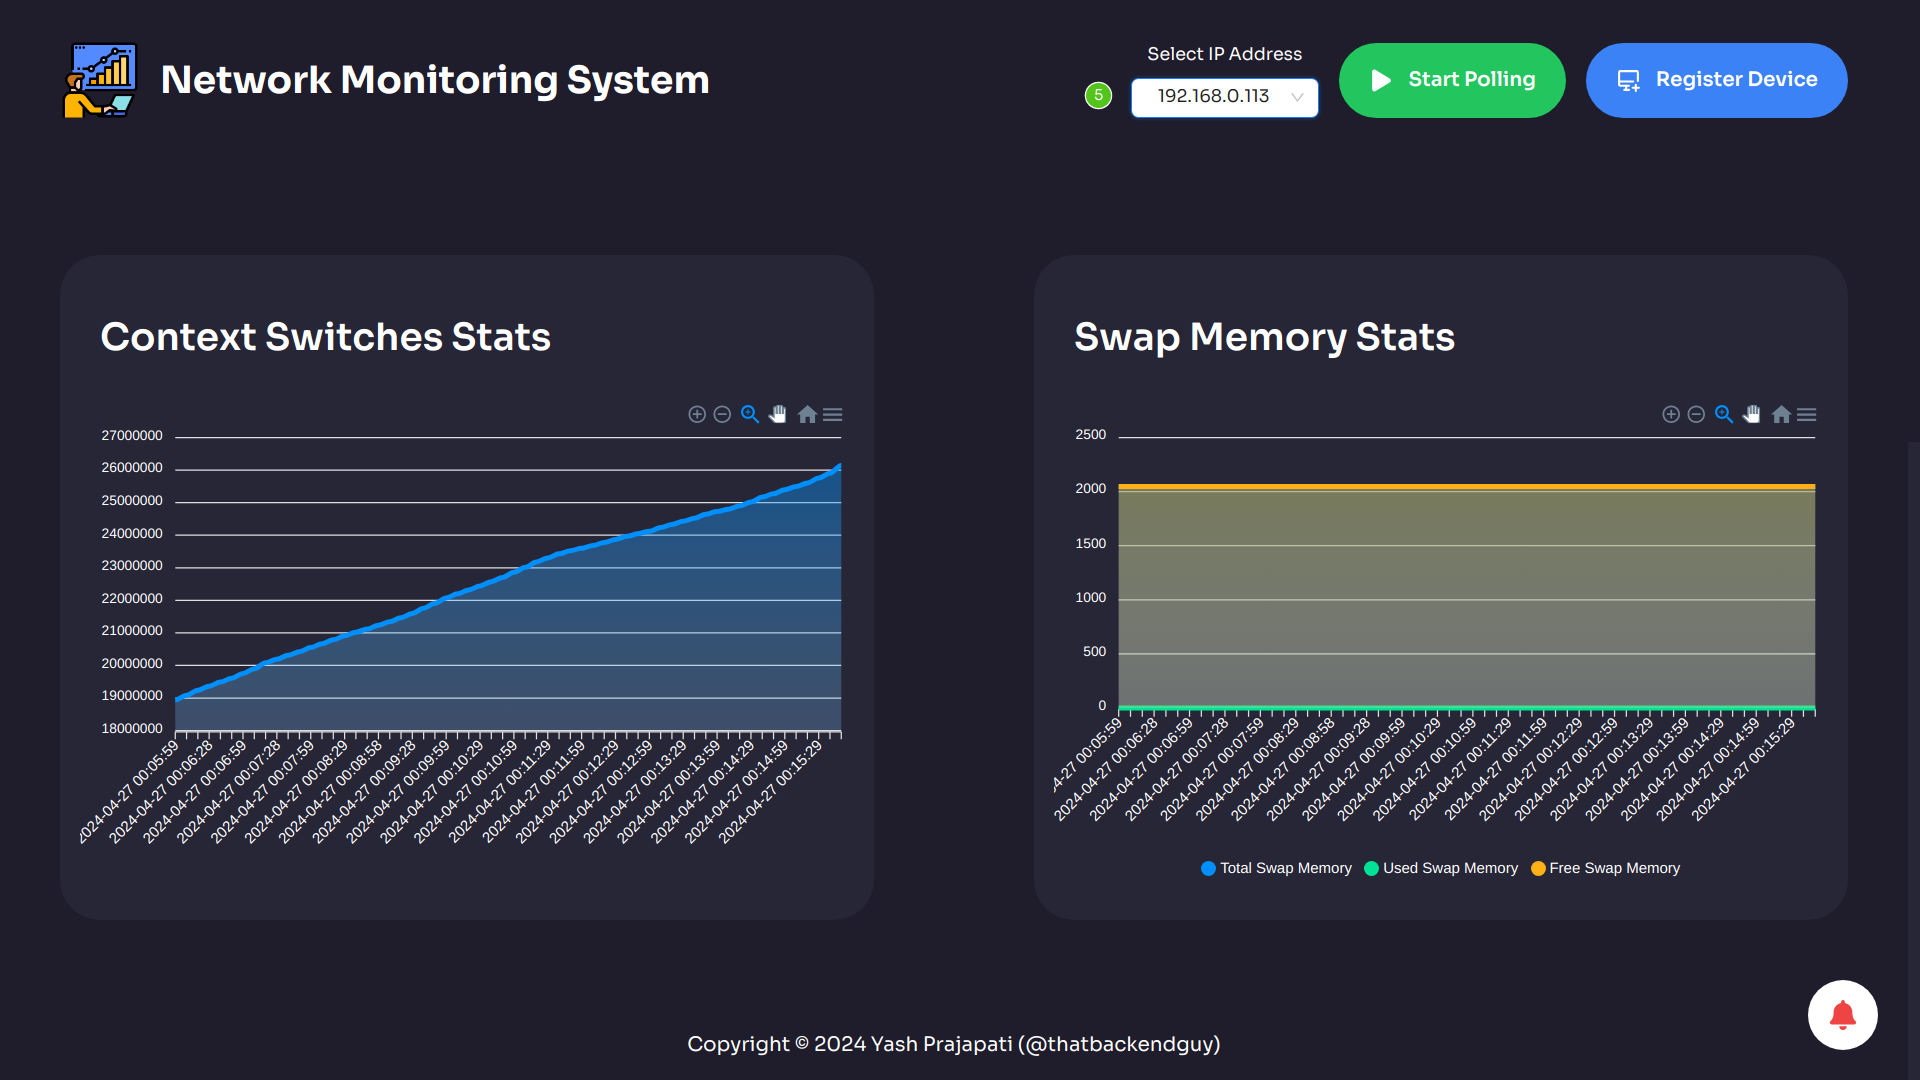
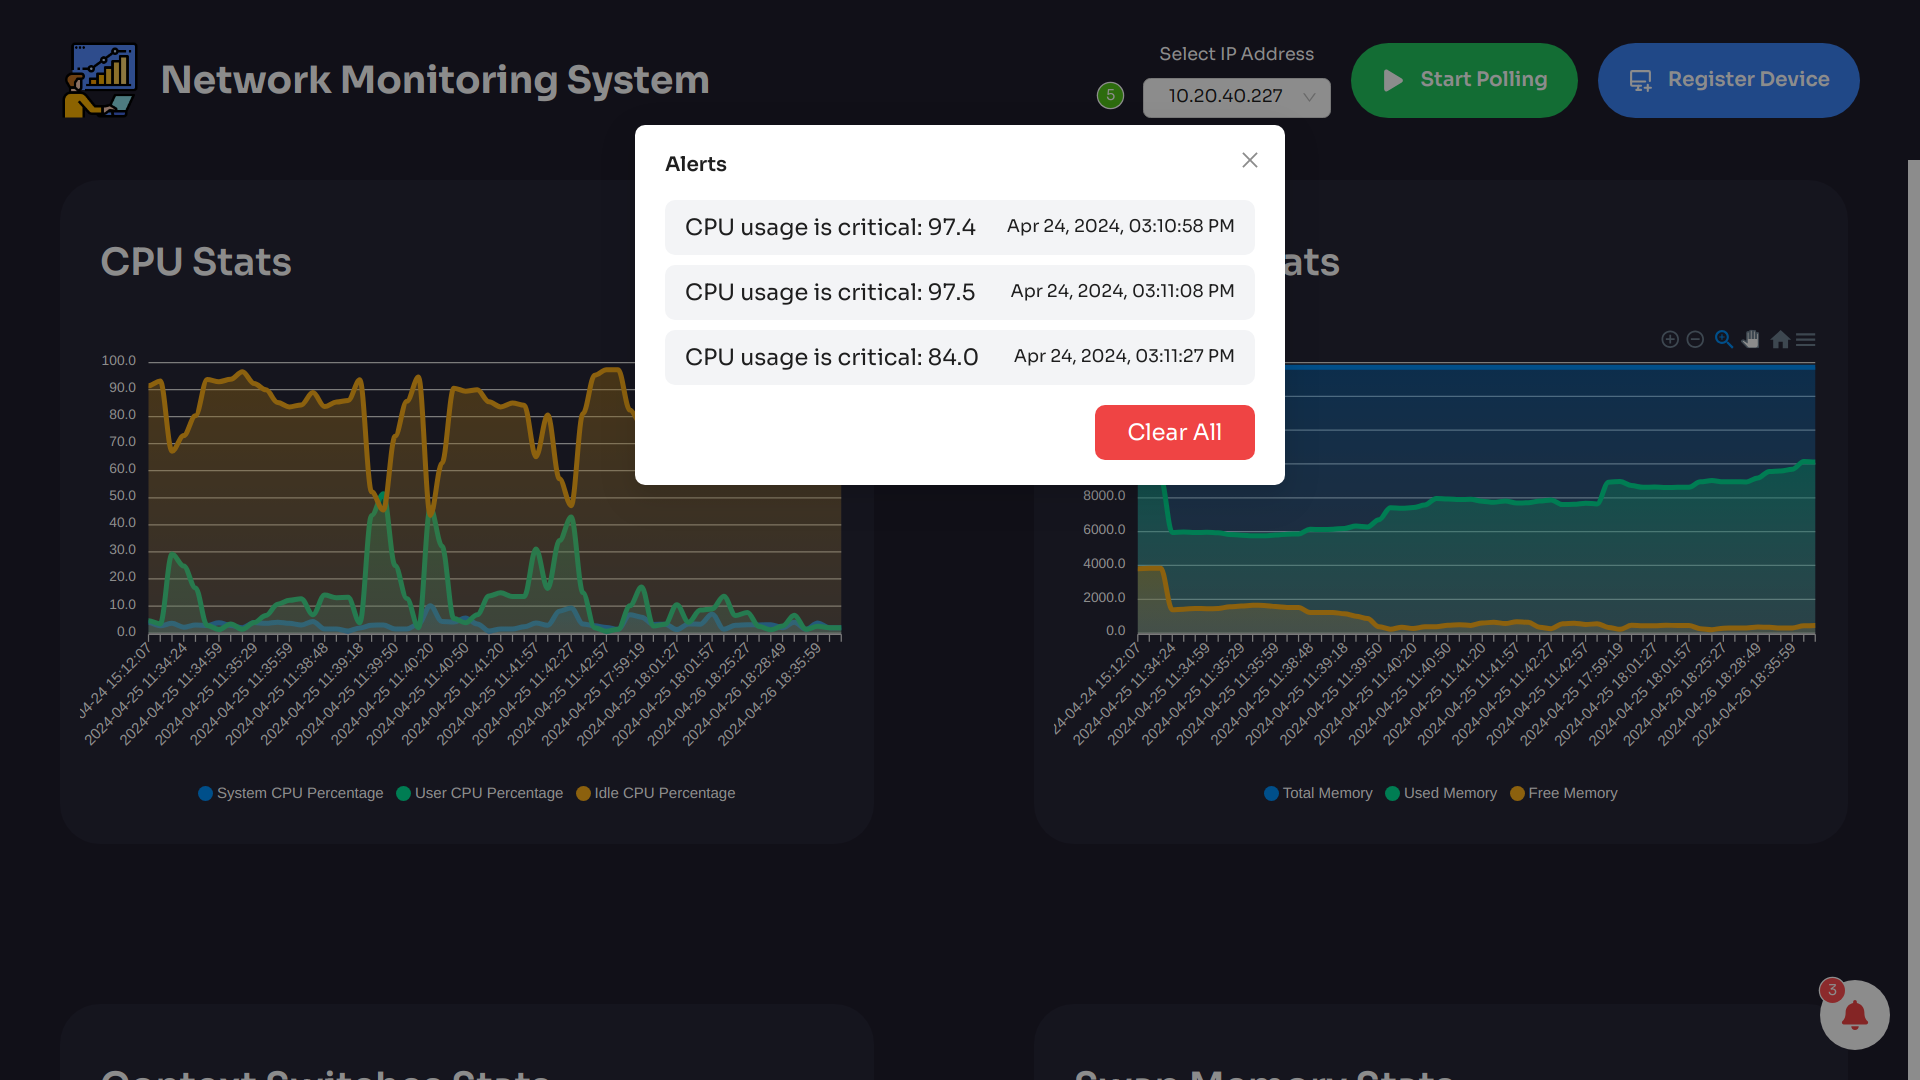
React, Tailwind CSS, and ApexCharts provide live and historical views for metric analysis and alert visibility.
Architecture
Event-driven services built for throughput
Java backend
Vert.x Core and Vert.x Web power non-blocking backend APIs and service orchestration.
Async messaging
ZeroMQ and Kafka move device data and events between services without blocking the collection pipeline.
Storage
MySQL and PostgreSQL support reliable metric, device, and alert persistence for operational workflows.
Demo
Walkthrough
Screenshots
Monitoring interface